Why put a designed binder into a CAR?
A chimeric antigen receptor (CAR) represents arguably the fastest route to turn a binder into a target-specific cell-killing agent. With conventional biologics (i.e., protein-based drugs), to do so one must rely on either weak, natural effector functions such as antibody-dependent cell-mediated cytotoxicity (ADCC) and complement-dependent cytotoxicity (CDC), or engineered moieties such as an anti-CD3 binder (effectively turning a binder into a T cell engager, TCE) or a cell-killing chemical compound (effectively turning a binder into an antibody-drug conjugate, ADC). All of these engineering steps require extensive optimization of protein expression and in some cases chemical conjugation, to ensure that binding is converted into effector function with high efficiency. Such projects operate on timelines of several months and budgets of well above $50,000 per binder. Therefore these engineering steps are often reserved until the binder sequences are narrowed down to no more than a handful. However, at that point the binders that would have turned out to be the best may have already been lost through arbitrary attrition of leads.
CAR-T cells, on the other hand, have a built-in linkage between the binder domain and the effector function: the binder is physically expressed on the effector T cells and fused with signaling domains for T cell activation. Although optimizations may still be needed to tune various properties of the CAR-T, one can often get a quick answer as to whether killing the target cell produces the anticipated biological effect. More importantly, when an efficient workflow is set up, one can test the cell-killing function of a binder with a much lower budget (see below).
What is missing in the cloud lab market?
Just like the BLI/SPR-based biophysical binding assays offered under the RootPath BinderVerse™ service, several cloud labs now also offer similar services that turn binder sequences to binding curves. However, testing binders as CAR-Ts requires a different set of expertise, including primary human T cell acquisition and culture, viral or non-viral gene delivery, T cell activation state management, and cell-based functional assays. Cell therapy CROs in theory offer such services, but the timeline and budget do not fit computational design. The conventional route to engineer CAR-T cells is to use lentiviral vectors. This route takes about a week to synthesize the genes, 1 to 2 weeks to make and titer the viral particles, 1 to 2 weeks to transduce and expand the T cells, often with a positive selection step to enrich the CAR-expressing population. After these steps one must deal with an often-overlooked nuance: the viral transduction step itself activates the T cells, and they have to be rested back toward a quiescent state before a co-culture step can be performed to read target-specific T cell activation. This 6- to 8-week schedule and the associated cost of usually >$10,000 are respectable for a therapeutic program after the binder sequence is already set, but cripplingly slow and costly in the DBTL loop where binder sequences are continuously optimized.
What we bring to the table
This is why RootPath decided to bring a decade of T cell engineering experience to the field of rapid binder testing. We have developed a novel method for pool synthesis and functional screening of T cell receptors (TCRs) in T cells using co-culture-based assays, as described in our Nature Biotechnology paper[1]. We have also provided TCR sequence-to-function service for dozens of leading TCR research groups worldwide for several years.
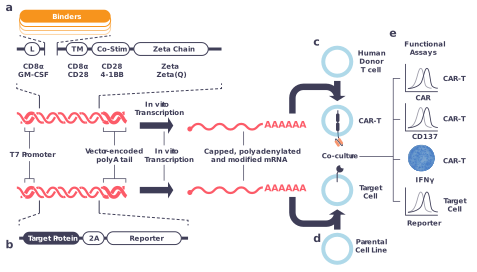
By adapting these innovations from TCRs to CARs, we collapse the timeline of CAR-T testing from 6 to 8 weeks to as short as 10 days (gene synthesis time included). A key component to highlight is the engineering of both T cells and target cells with mRNA rather than virus (Fig. 1a,b). CAR-encoding mRNA is transcribed in vitro from a T7 promoter with a vector-encoded polyA tail, capped and nucleoside-modified, then delivered to donor T cells by electroporation. We have extensively optimized the composition of mRNA, capping methods and electroporation protocols, and have shown strong but tunable surface CAR expression one day after electroporation, without activating the T cells. This means the co-culture assay can be performed immediately thereafter (Fig. 1e).
In parallel to CAR-T preparation, we prepare target cells using a similar procedure (Fig. 1b,d). Rather than building a stable line per target, we deliver target-encoding mRNA to a parental cell line, with a truncated CD19, EGFR or NGFR reporter downstream of a self-cleaving 2A peptide. The reporter expression can be used as a proxy for surface target density, which is tunable by modulating the amount of mRNA used in the electroporation. This ability to tune target expression level is critical when evaluating T cell function at different target protein densities on the target cell.
End-to-end workflow
As usual, you first upload the binder sequences. Then the CAR backbone surrounding the binder (named by the Backbone Code in the benchmarking figures below) can be customized with different versions of the leader peptide (e.g., CD8$\alpha$ or GM-CSF), transmembrane domain (e.g., CD8$\alpha$ or CD28), co-stimulatory domain (e.g., CD28 or 4-1BB) and the zeta chains (e.g., with or without the C-terminal Gln). On the target cell, you can choose the base cell line (with default being K562) and optionally the target gene. If the base cell line already expresses the target gene endogenously, the target gene can be skipped.
We will carry out gene synthesis, colony screening and plasmid preparation in ~4 days. We will then prepare mRNA and do a pilot run of electroporation to observe CAR and target expression levels on the T cells and target cells, respectively. If everything goes well, we will repeat the electroporation process and perform the co-culture for ~24 hours, followed by detection of T cell activation signals such as IFN$\gamma$ secretion using ELISPOT and CD137 (4-1BB) upregulation using flow cytometry.
CAR backbone characterization
We cloned the same anti-CD19 scFv (Hu19) into 12 different CAR-T backbones, varying the combination of the hinge (CD8$\alpha$ or CD28), the transmembrane domain (CD8$\alpha$ or CD28), the costimulatory domain (CD28 or 4-1BB), the zeta chain (with or without the C-terminal Gln), the signal peptide and the VH/VL linker. In this project, the CAR construct also includes an eGFP-encoding sequence downstream of the CAR, separated by a self-cleaving 2A peptide.
The CAR mRNA was electroporated into T cells to produce CAR-T cells. In parallel, CD19-encoding mRNA was electroporated into K562 cells to produce target cells. These two cell preps were co-cultured. As controls, CAR-T cells were also co-cultured with parental K562 cells, and cultured alone.
As shown in Fig. 2 (5 representative constructs out of the total 12), roughly 70 - 90% of T cells in all conditions expressed eGFP, indicating high electroporation efficiency. When the CAR-T cells are co-cultured with CD19-expressing K562 cells, roughly 80 to 100% of the eGFP$^+$ cells became CD137$^+$. In conditions where both CD137$^+$ and CD137$^-$ CAR-T cells (i.e., eGFP$^+$) are observed (e.g., Fig. 2a, left panel), the median fluorescence intensity in the CD137 channel (CD137 MFI) of the CD137$^+$ cells is about 2 orders of magnitude higher than that of the CD137$^-$ cells, providing unambiguous evidence for T cell activation. Similarly, the CD137 MFI of all eGFP$^+$ cells is 2 to 4 orders of magnitude higher in the CAR-T cells co-cultured with CD19-expressing K562 than in those co-cultured with parental K562 or cultured alone, providing strong evidence for CD19-specificity (Fig. 2, right panels).
==
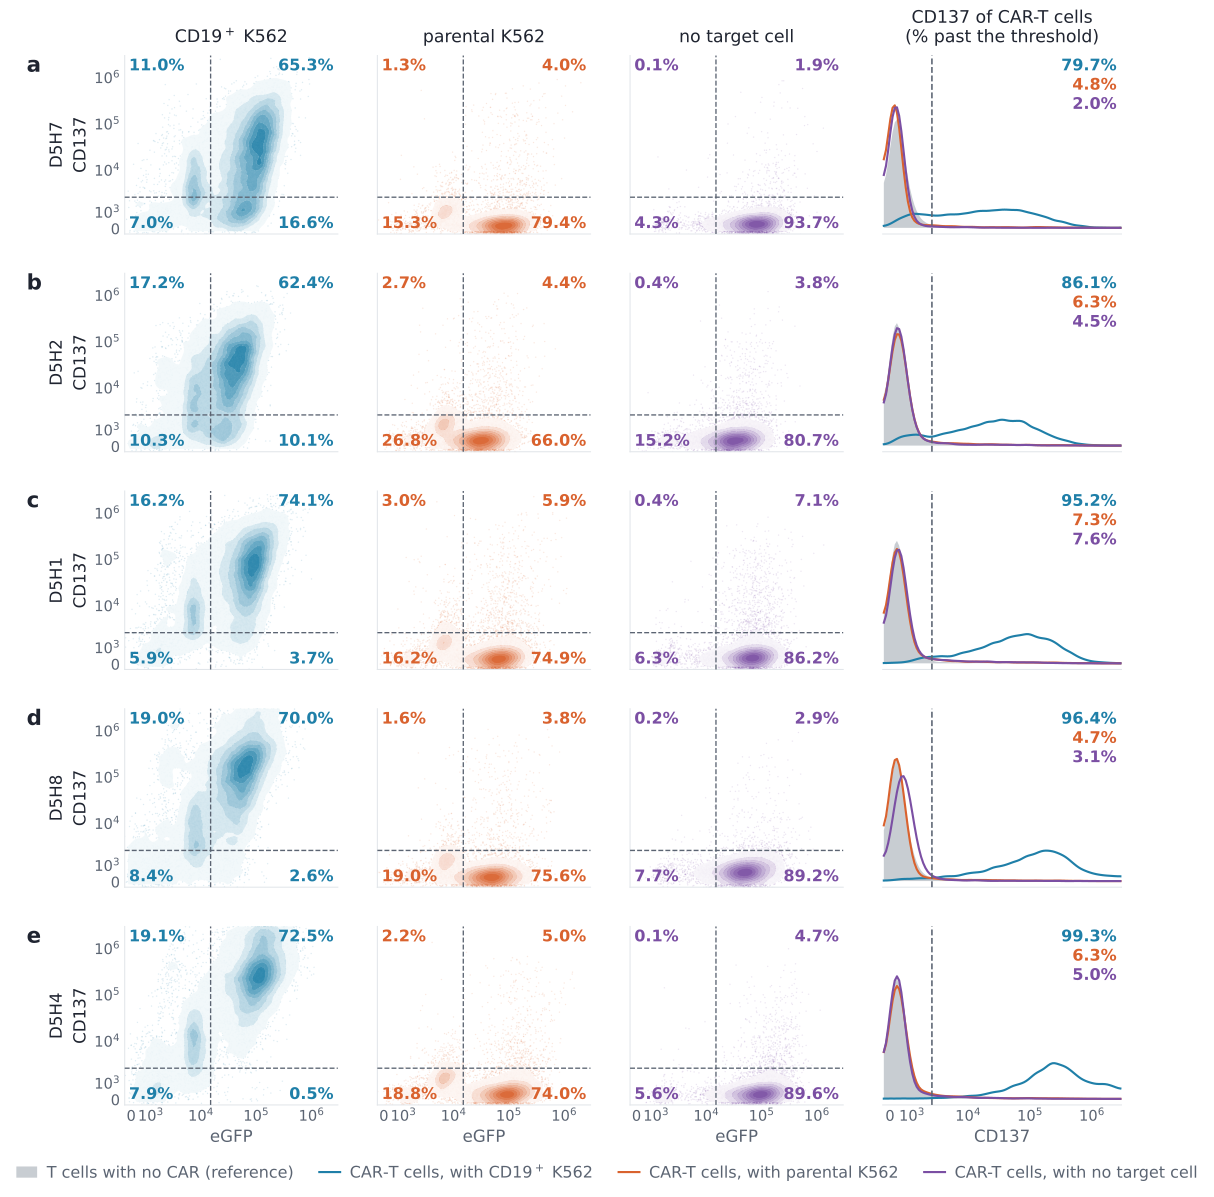
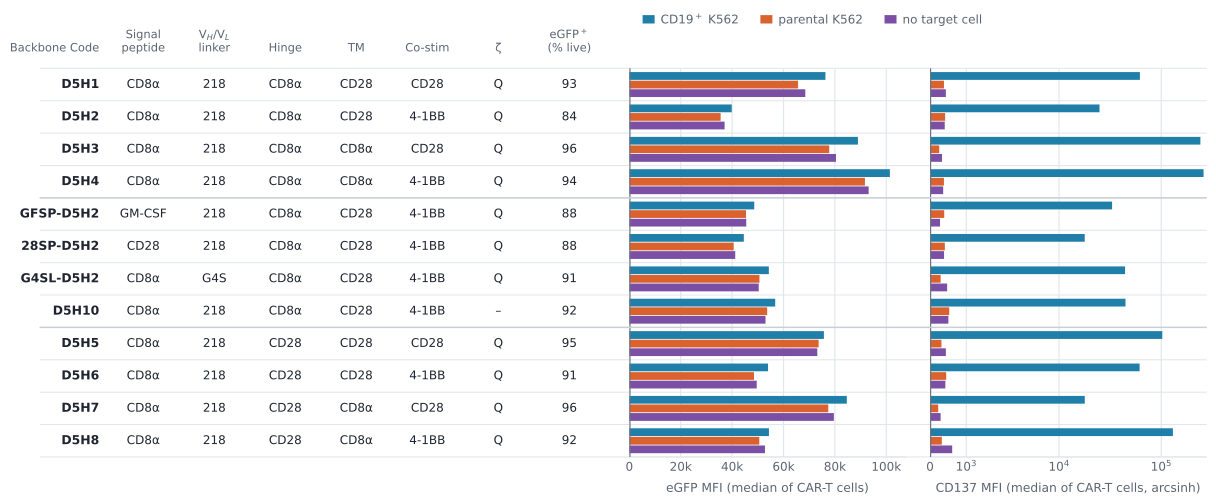
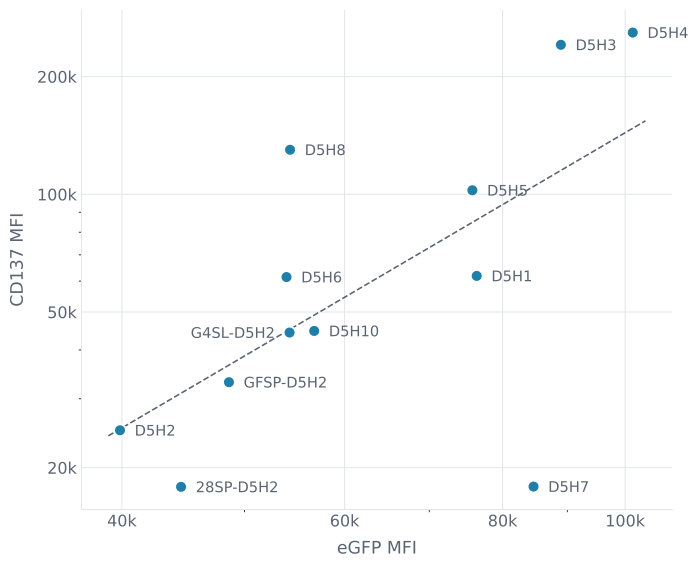
Fig. 3 shows a summary of all 12 constructs, along with the exact domain combination of each construct. It can be seen that while qualitatively all constructs result in successful electroporation and antigen-dependent T cell activation, quantitatively, both metrics vary across these 12 constructs. It is somewhat expected that the eGFP MFI correlates with CD137 MFI, suggesting that higher expression level of the CAR constructs leads to higher activation. However, outliers clearly exist, with D5H3 and D5H7 showing clearly higher and lower CD137 MFI than the line of regression predicts (Fig. 4).
==
==
Benchmark: Self-reactivity with EGFR-targeting CAR-Ts
We next tested four EGFR binders: two minibinders, one against a C-terminal epitope of the EGFR ectodomain and one against an N-terminal epitope (named EGFRc and EGFRn, respectively), and two scFvs obtained from the literature (named P2224[2] and JQ306330[3]). The project had a second objective: identifying the best way to place an affinity tag (e.g., FLAG or Myc) to the N-terminus of the CAR construct, so that the cell-surface expression of the CAR can be directly assessed by antibody staining, rather than using eGFP as a proxy.
Each minibinder was therefore built in four versions of the tag cassette, placed between the leader peptide and the binder. The variable is the presence of a (G$_4$S)$_2$ flexible peptide upstream or downstream of the Flag or Myc, e.g.,:
- 2Flag2 means (G$_4$S)$_2$-Flag-(G$_4$S)$_2$
- 0Flag2 means Flag-(G$_4$S)$_2$
The two literature scFvs instead carry an N-terminal 3xFlag tag. However, prior experiments showed that these tags do not stain well (data not shown), so we instead used G$_4$S-repeat-specific antibodies to stain the scFvs, which carry a G$_4$S linker between the VH and VL domains.
Representative constructs in the T cell alone (i.e., no target cell) condition show >90% eGFP$^+$ rate, indicating high electroporation efficiency (Fig. 5). Although the Myc tag (Fig. 5e-h) appears to be stained less efficiently than the FLAG (Fig. 5a-d) or the G$_4$S tag (Fig. 5i-k), the vast majority of eGFP$^+$ cells are still Myc$^+$ in the Myc-containing constructs (Fig. 5e-h).
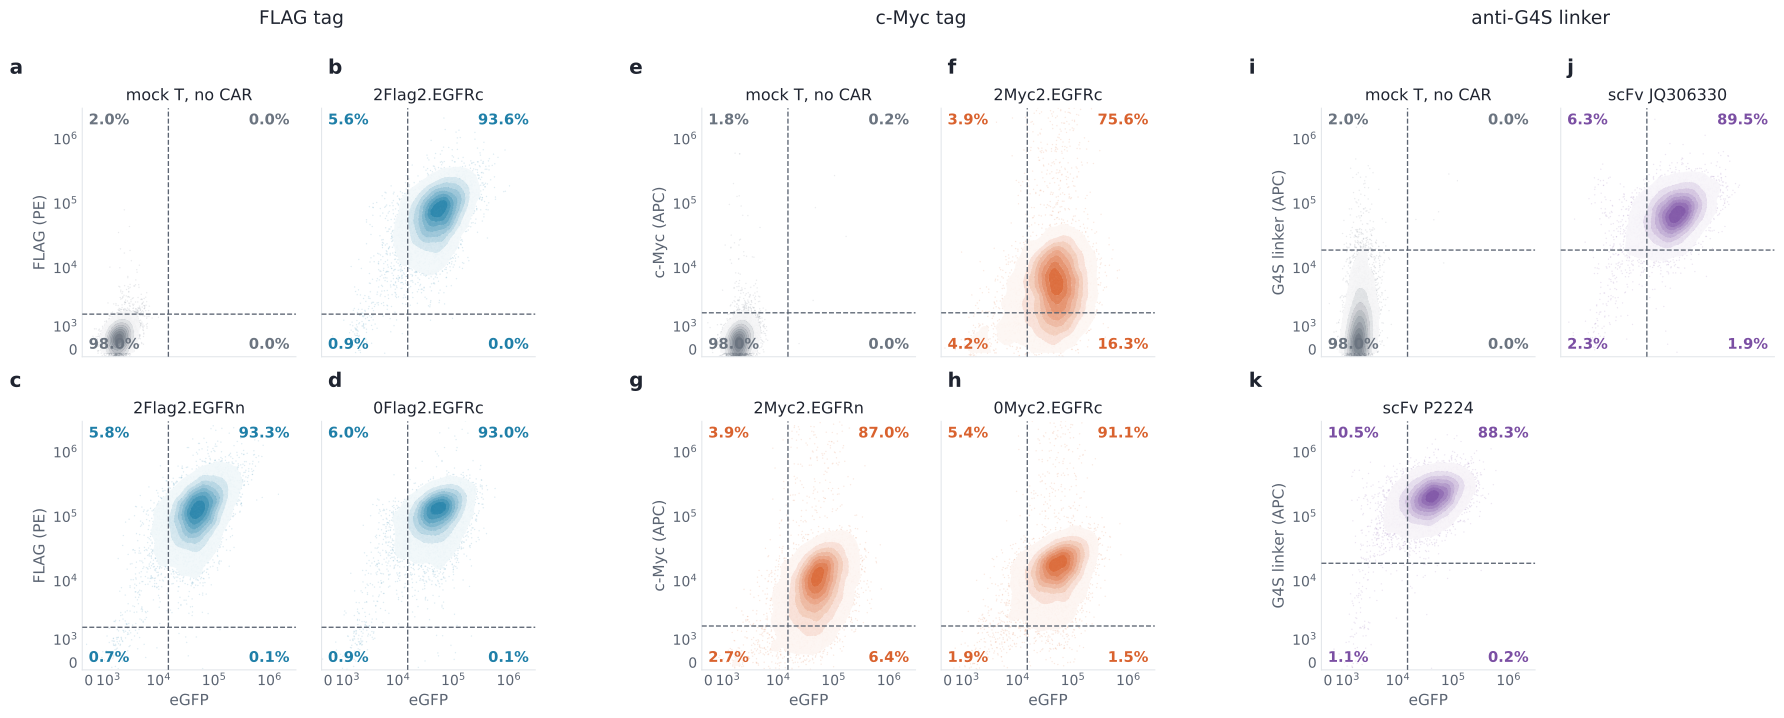
Figure 5. CAR expression assessed with direct staining of the affinity tag and eGFP reporter expression. CAR-T cells were cultured alone without target cells. Both axes are on an arcsinh scale with cofactor 1100. Cells in panels (a-d), (e-h) and (i-k) are stained with anti-FLAG, anti-c-Myc, and anti-G4S linker antibody, respectively. Cells in panels a, e, i are mock T cells that received no CAR. The four percentages are fractions of live cells and sum to 100.
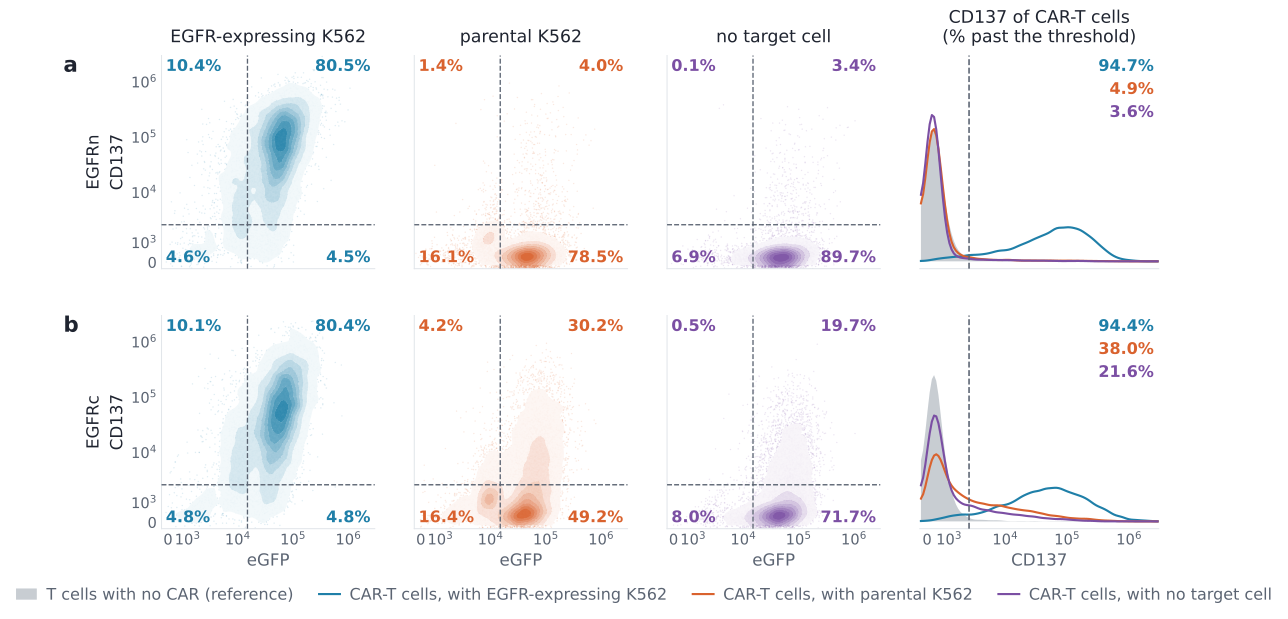
When the CAR-T cells of 0Flag2-EGFRn and 0Flag2-EGFRc CAR-Ts were co-cultured with EGFR-expressing K562, strong CD137 upregulation is observed (94.7% and 94.4% of eGFP$^+$ cells became CD137$^+$, respectively). However, the 0Flag2-EGFRc CAR-T showed a substantially higher fraction of CD137$^+$ cells when cultured with parental K562 (38.0%) or cultured alone (21.6%) compared to the 0Flag2-EGFRn CAR-T (4.9% and 3.6%, respectively), suggesting the EGFRc CAR may react to non-target proteins on K562 cells or T cells.
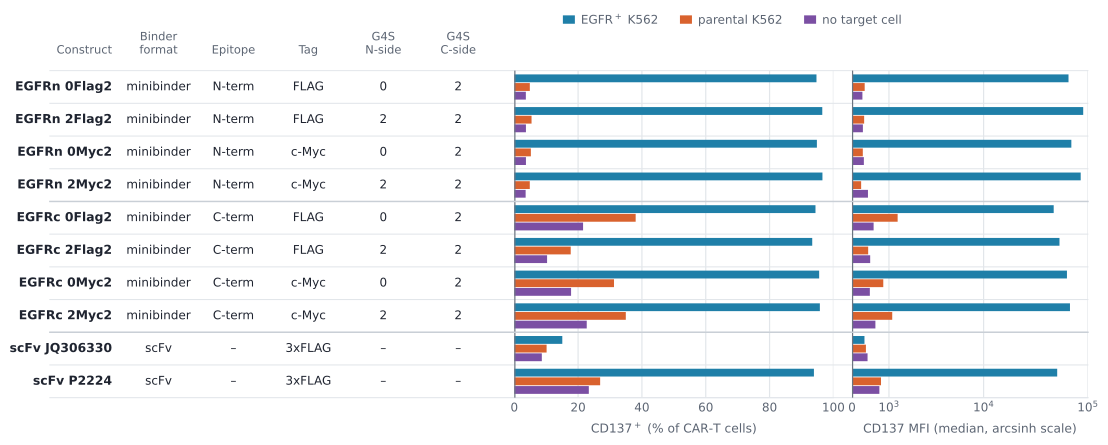
The tendency of EGFRc CAR to trigger target-independent T cell activation appeared to be independent of affinity tag choice or (G$_4$S)$_2$ (Fig. 7). The scFv P2224 showed a similar level of target-independent T cell activation to the EGFRc binder, while the scFv JQ306330 showed neither target-dependent nor target-independent T cell activation (Fig. 7).
Conclusion
We have established a facile workflow to turn binder sequences into CAR-T function within 10 days. The mRNA electroporation-based technology generated CAR-T cells with robust CAR expression. Using CD19 and EGFR binders, we showed that CAR-T cells generated with this workflow can not only detect CAR- and target-mediated T cell activation with unambiguous results, but also provide nuances such as the correlation between T cell activation level and CAR expression level, as well as off-target T cell activation.
Getting started
If you are designing binders against a cell-surface target and want to know whether they can be used to reprogram T cells, email me at [email protected] or book an online meeting. The CAR-T pipeline runs on RootPath BinderVerse™ alongside the biophysical ones, so you can conveniently set up projects to compare BLI/SPR-based binding kinetics and CAR-mediated T cell engagement.
– Xi Chen
References
- Moravec Z, et al. (2024). Discovery of tumor-reactive T cell receptors by massively parallel library synthesis and screening. Nat Biotechnol 43(2):214-222. doi:10.1038/s41587-024-02210-6
- Lehmann A, et al. (2015). Stability engineering of anti-EGFR scFv antibodies by rational design of a lambda-to-kappa swap of the VL framework using a structure-guided approach. mAbs 7(6):1058-1071. doi:10.1080/19420862.2015.1088618
- Zhou YQ, et al. (2012). Escherichia coli expression and refolding of truncated extracellular domain of EGFR for the generation of its human scFv derived from a phage display library. GenBank JQ306330.1. Full text